Find this procedure explained in a video here
Why ProfilSol
- The first method is based on a visual analysis of pedomorphological characteristics used to determine the structure (type, class, grade), consistence and porosity of soil in CanSIS' “Manual for describing soils in the field” (1982). These descriptions have been weighted to qualify soil structure on a scale of 0 to 10 in terms of horizon boundaries and five texture groups.
- The second method employs image analyses of soil placed on white coroplast to display its structure. Results are sorted by into four visual analysis classes and three image analysis classes, which allows for method comparison and efficient observation of any issues in the soil profile.
ProfilSol allows for geolocating and dating soil profiles. The user is therefore able to compare different profiles taken from different places or on different dates, in order to evaluate the level of soil degradation compared to a control sample or to its change over time, after putting in place corrective or soil conservation measures.
Over time, ProfilSol should evolve to meet demand to include new functionalities that allow for on-the-ground analysis of other soil health properties or indicators, and for fostering a collaborative, communal approach to qualifying soil's health, and especially its physical condition.
Section A - How to Use ProfilSol
A.1 - Where to create the profile?
Choice of profile location will depend on the desired outcome (evaluation of problem areas or the effect of changes in practices), and it is important for the profile to be representative of the target zone. If you are targeting problem areas (e.g. an area that is compacted or low-yield), avoid the heavily trafficked edges of the field.
Compare problem areas to a soil profile in good physical condition (control). The control profile should be located close by, in soil of the same type (similar in grain size and drainage class). Soil under windbreaks, wasteland, fencerows, old meadows or fields with a history of good yields may serve as a control area for comparison.
A.2 - Periods and Conditions of Moisture
- From the beginning of the season through after harvest (between April and June).
- The end of the season (September to October).
- The middle of the season (July-August) when vegetation is too dense or soil too dry
- Saturated water regime
- Wet-to-dry soil (field capacity)
- Too dry - clayey soils are too firm and difficult to handle, and sandy soil becomes powdery
- Waterlogged soil - saturated with water
Undertaking major works (e.g. subsoiling, drainage work or levelling) will significantly affect soil structure. Soil profiles taken in a disturbed plot will be much more variable from one place to another. However, identifying these soils can allow us to observe their evolution over time.
A.3 - Required materials
- Round point shovel
- Stiff-handled blade
- Measuring tape
- Water bottle
- White, 33cm x 44 cm coroplast for taking 4:3 format images
- Colored objects (colored pencil, knife, etc.) to define horizons and layers (optional)
- Tarp (optional)
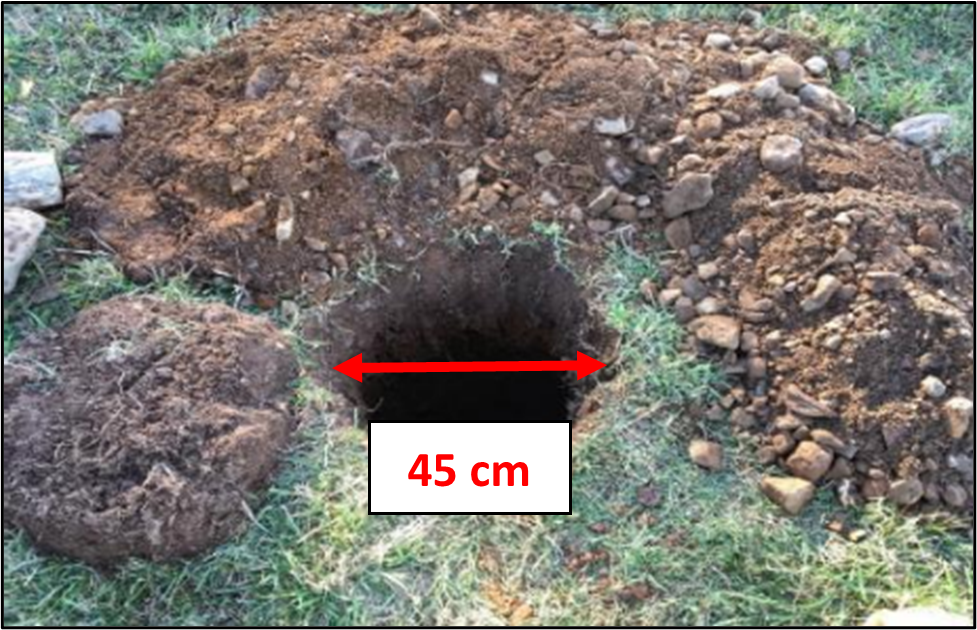
A.4 - Dig Out the Profile
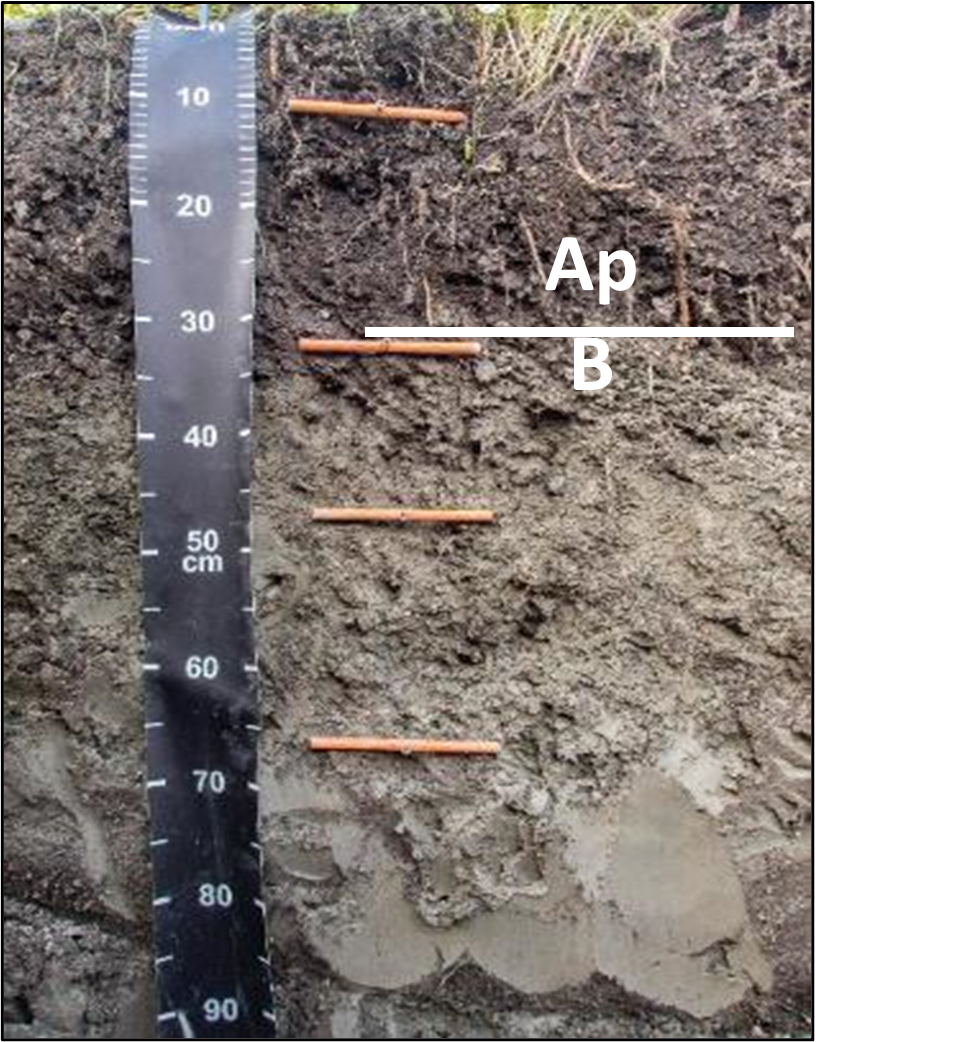
A.5 - Define the Layers
- Identify the Ap and B horizonsThe delineation between the Ap and B horizons can be identified by a contrast in color, structure or granularity (course texture and/or fragments). Generally, the Ap layer (enriched by organic matter) is darker than the B layer and its lower delimitation varies between 15 and 40 cm.
- Identify the middle layersBetween horizons Ap and B, it is possible to observe one or several layers with a different structure or color. We can record up to three middle layers per horizon.
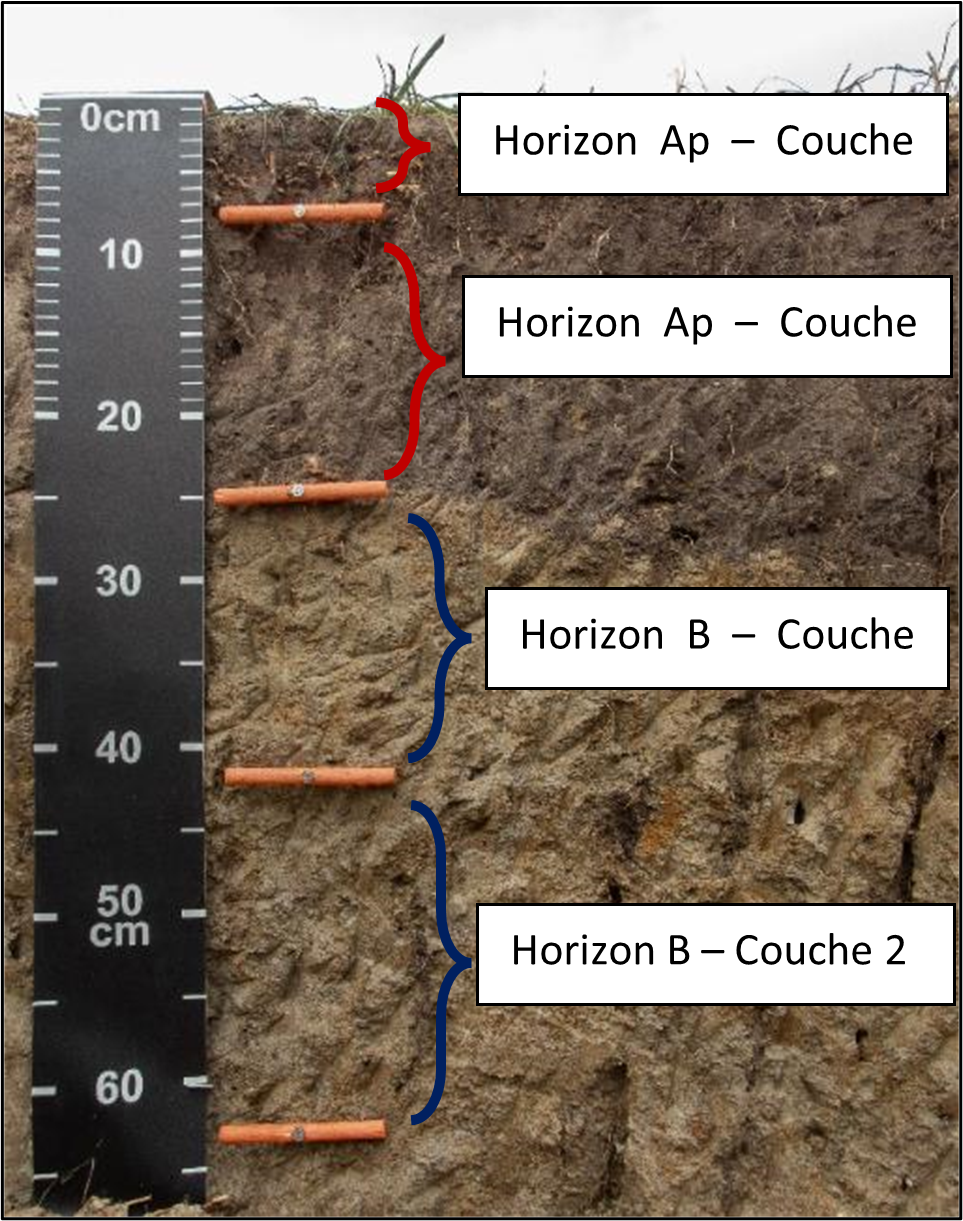
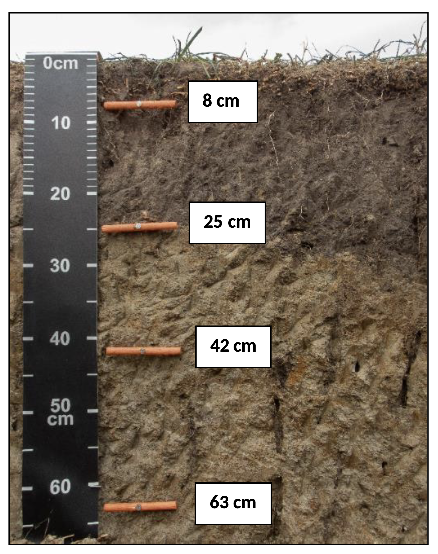
- Record the layers' lower boundariesEnter only the depth of the lower boundary of each layer identified in the profile.
Section B - Visual Analysis
B.1 - Collect and observe a soil sample
- Use a rigid-handled knife to collect a soil sample from the profile layer to be analyzed.
- Handle the sample carefully to observe the natural structure of the soil.
- Place the sample on the coroplast for clearest observation.
- Collect more than one sample per layer to best analyze its structure.
B.2 - Qualify the moisture level of the layer
- Wet: At field capacity, i.e. dried after saturation or heavy rain.
- Dry: Dryer than at field capacity, but not excessively dry.
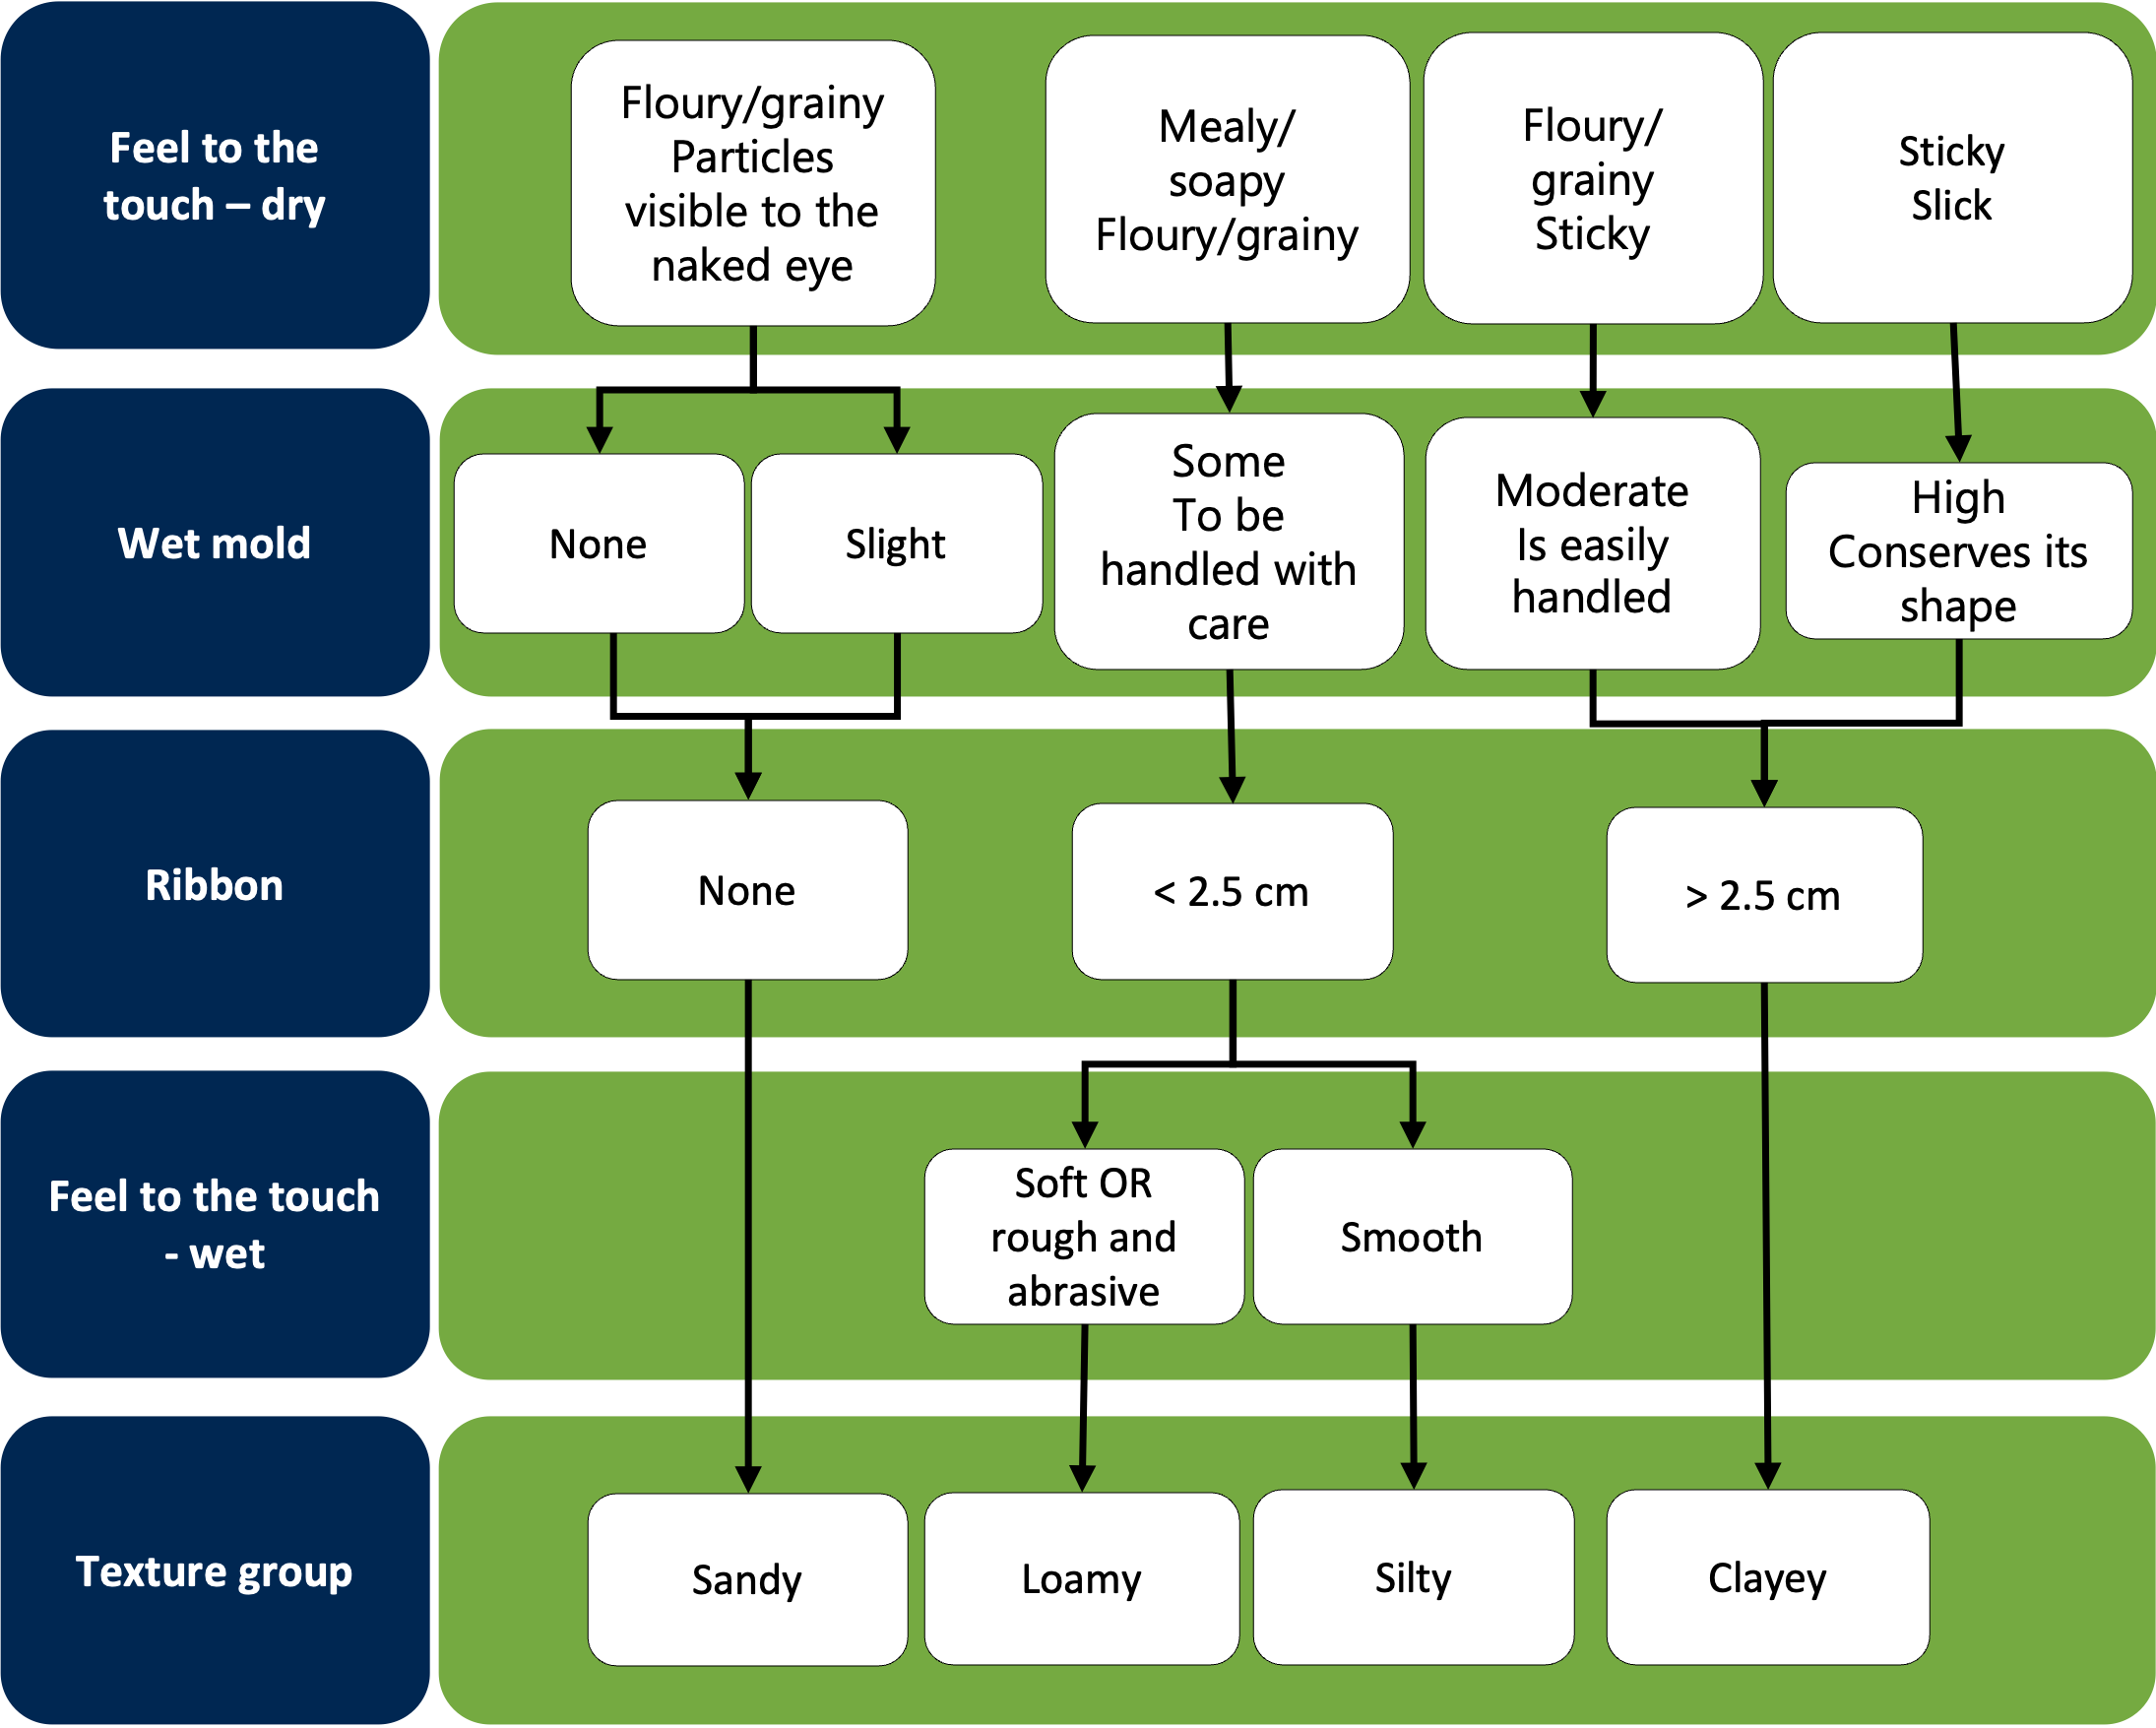
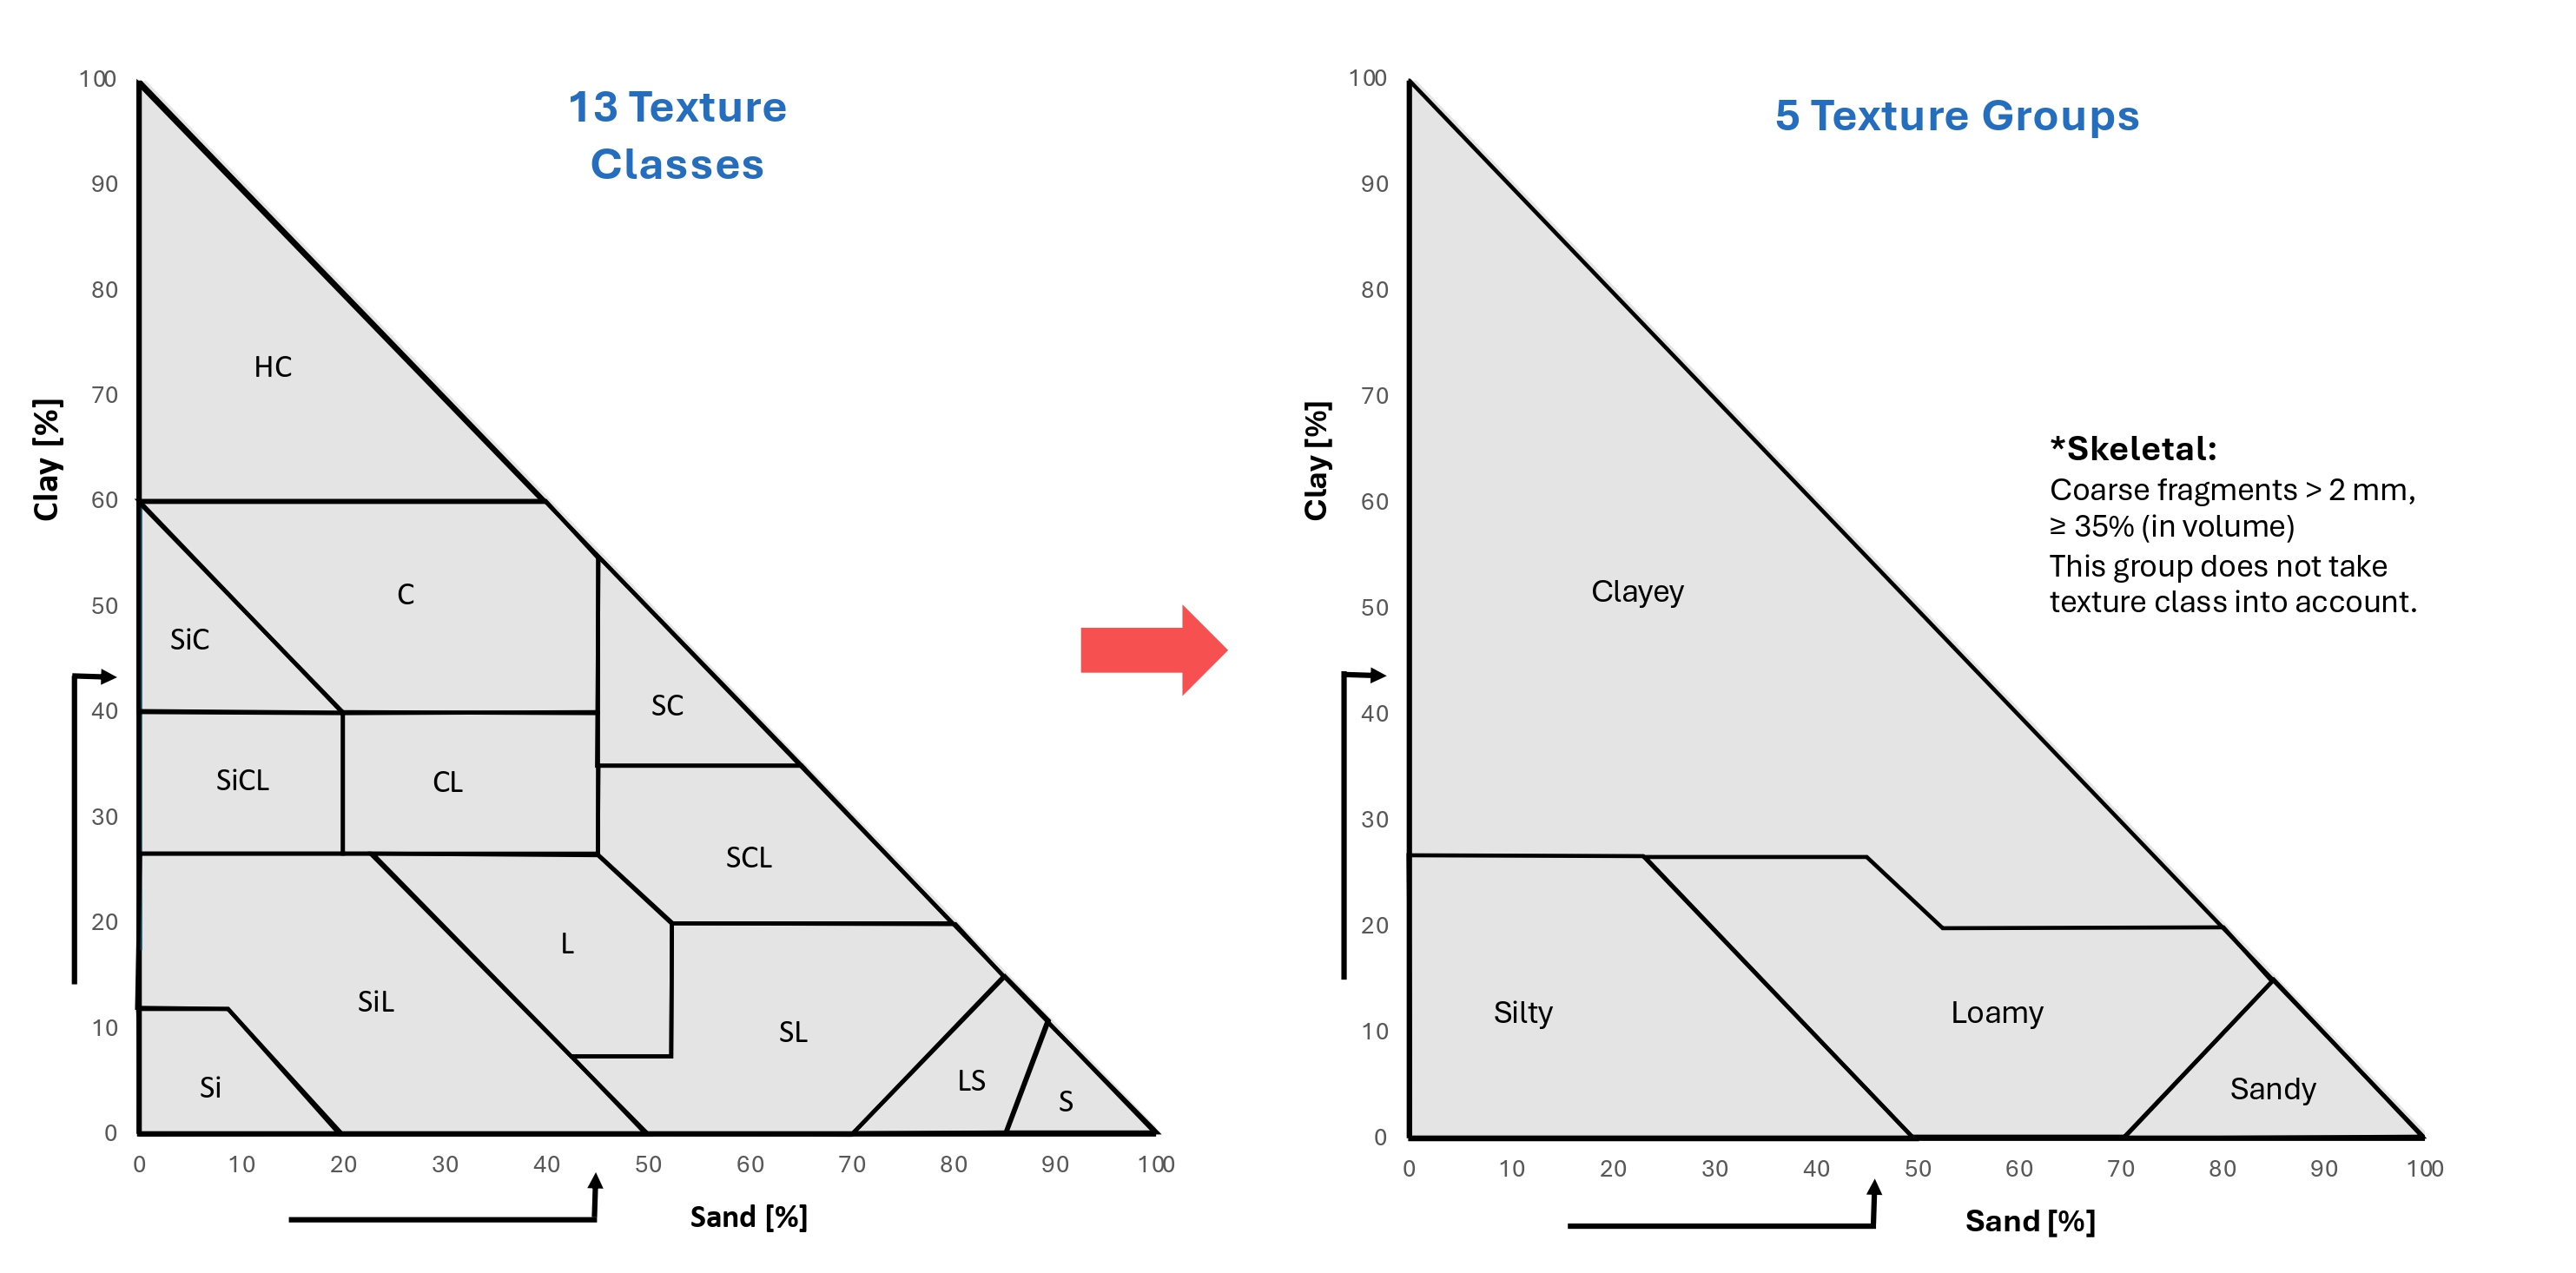
B.3 - Determine the texture group
The figure below shows the grouping of 13 texture classes and five texture groups.
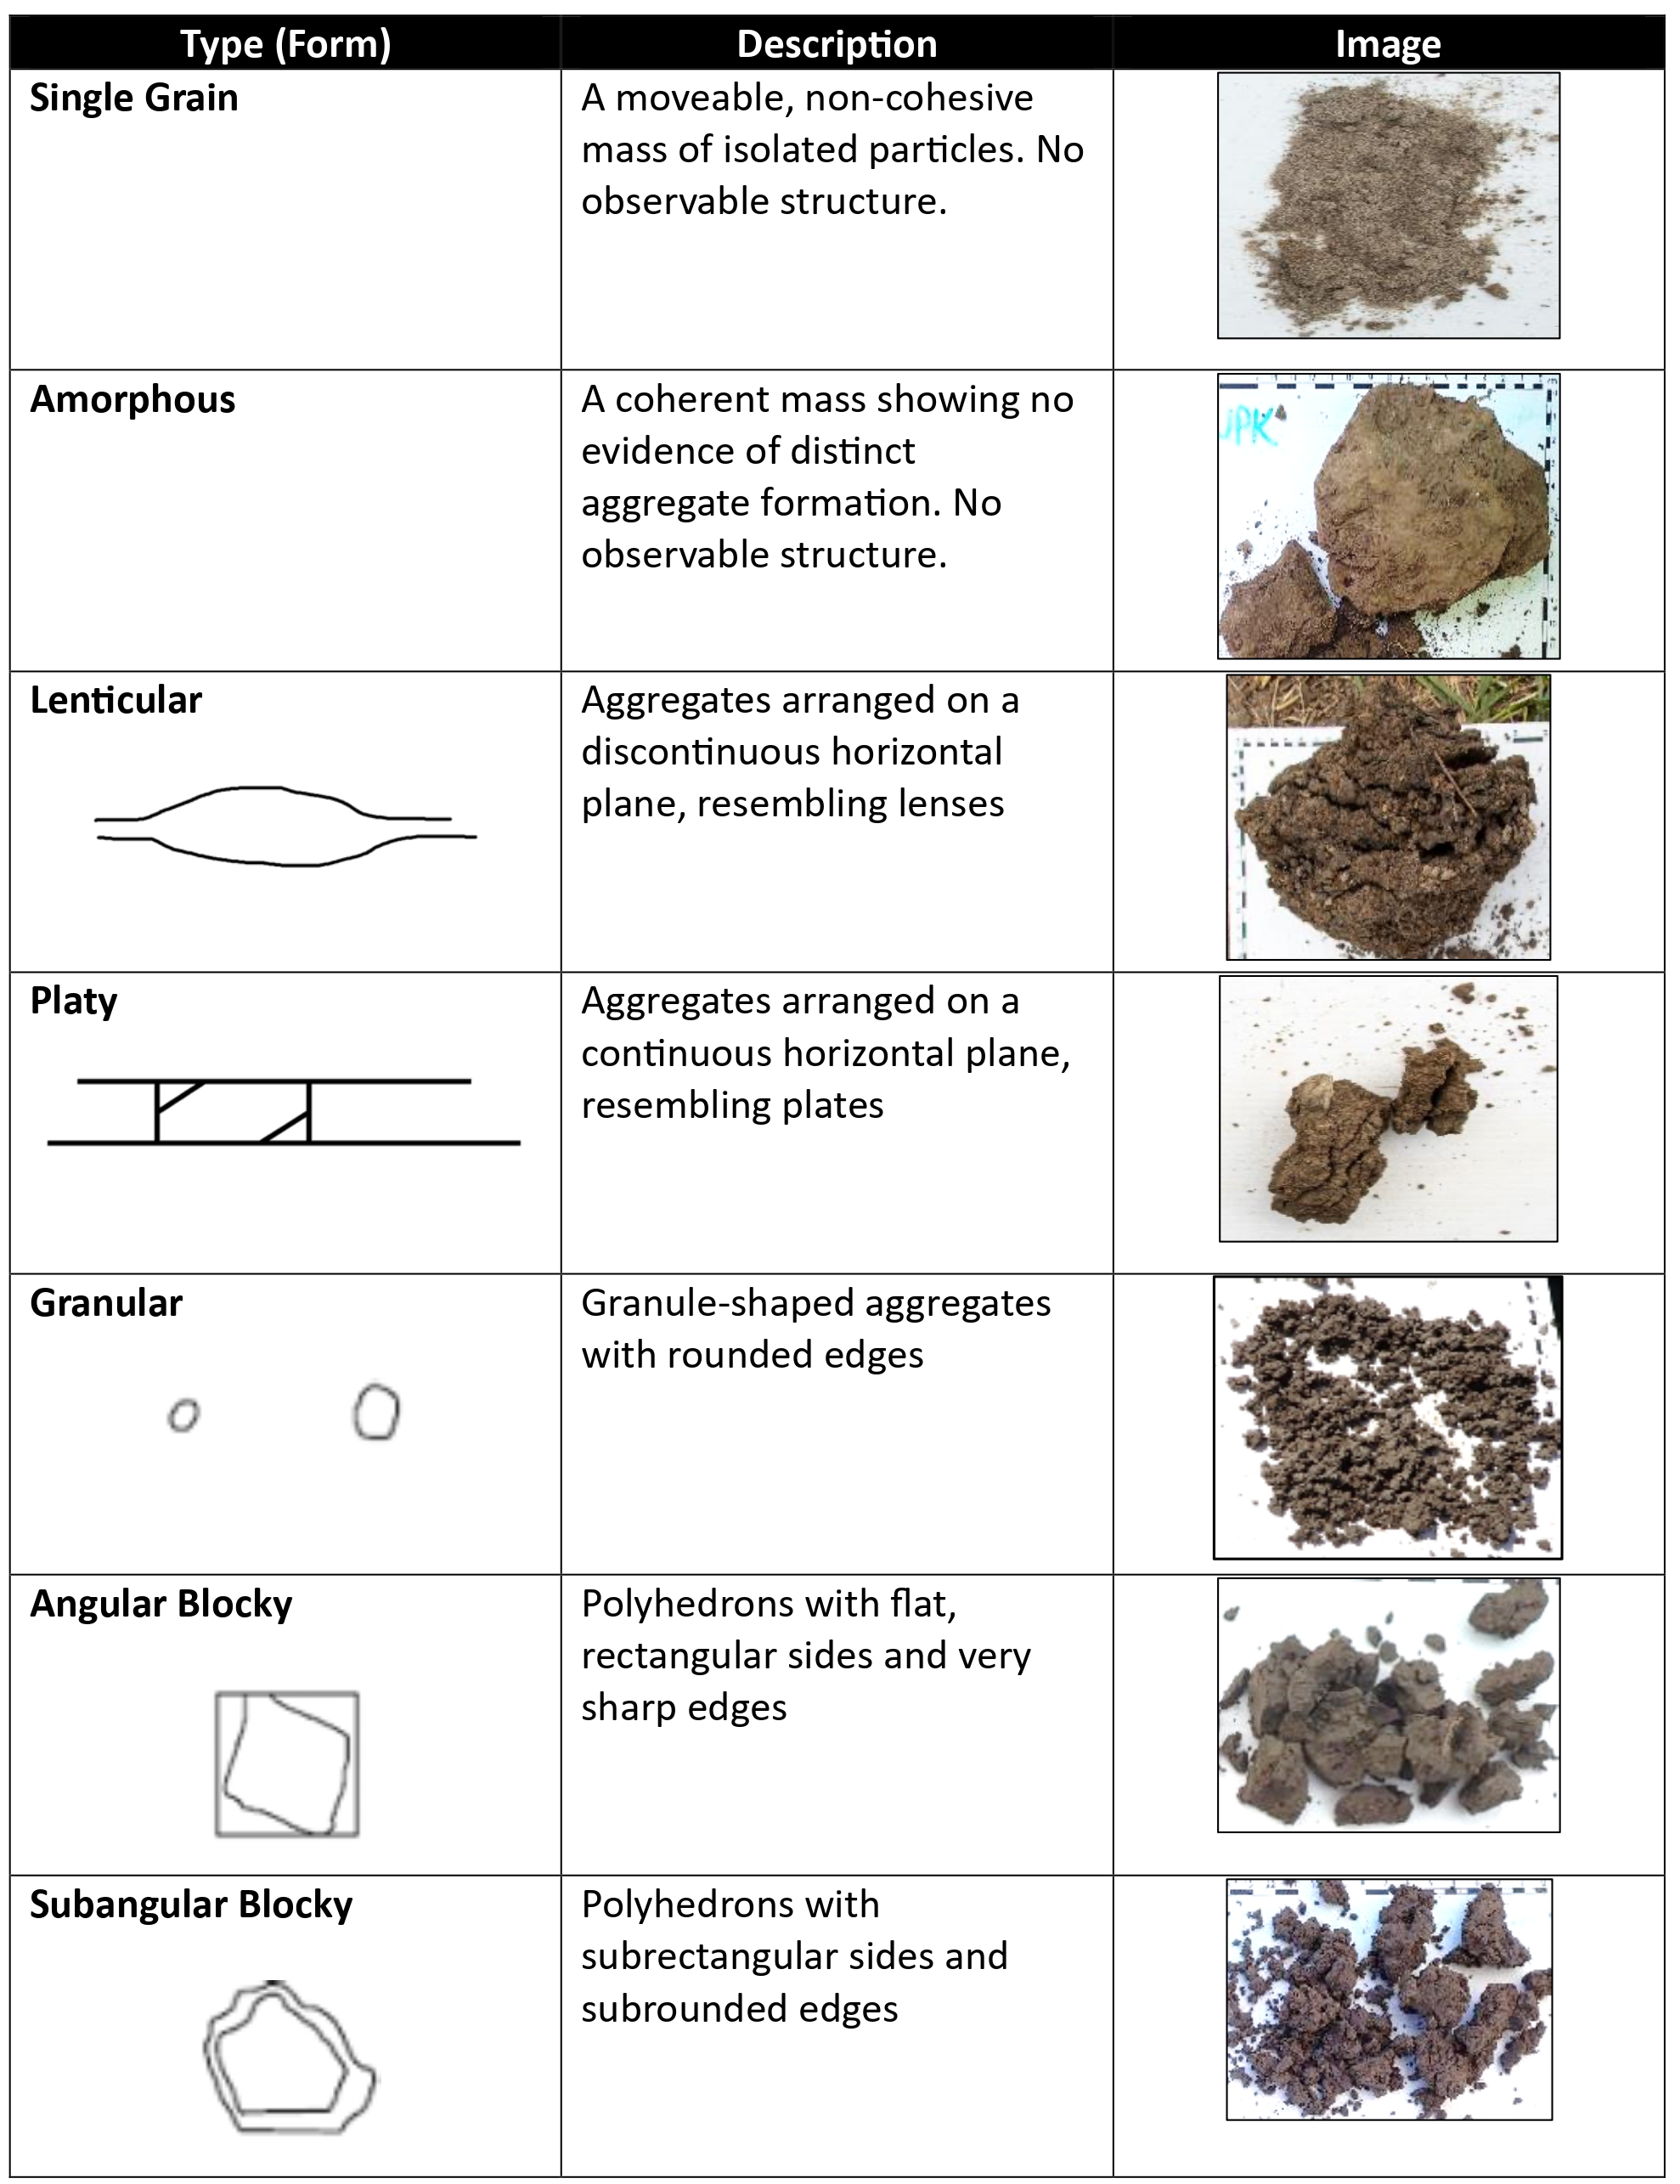
B.4 - Structure Type
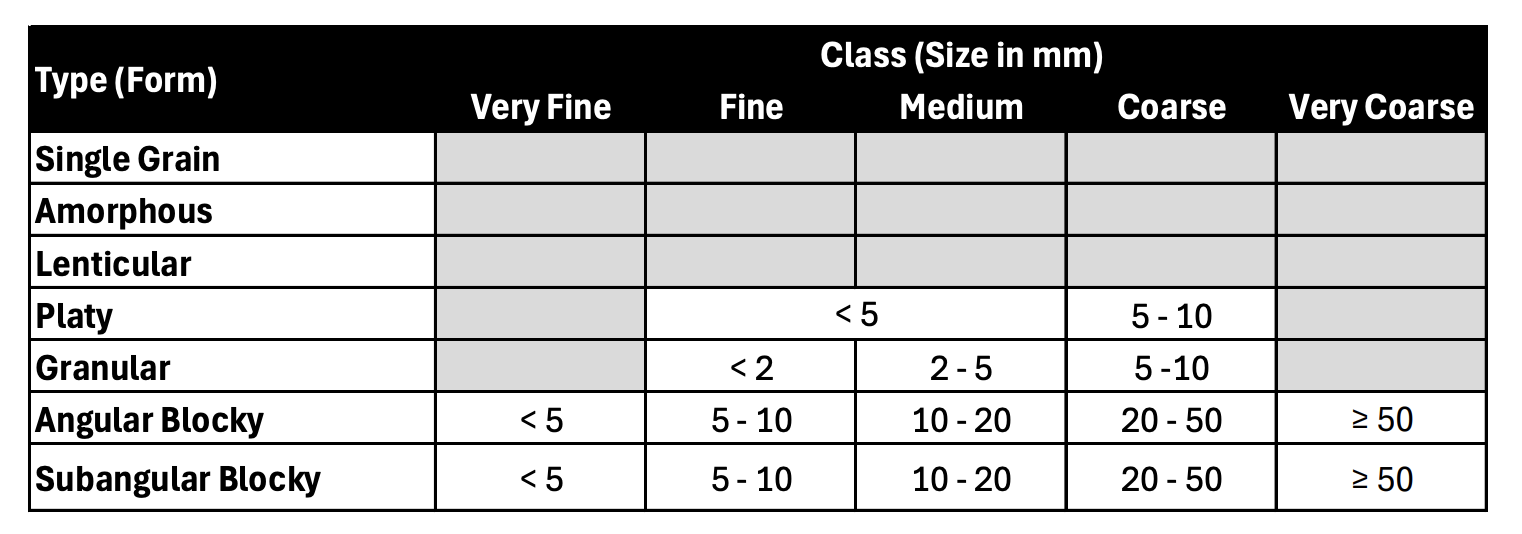
B.5 - Structure Class

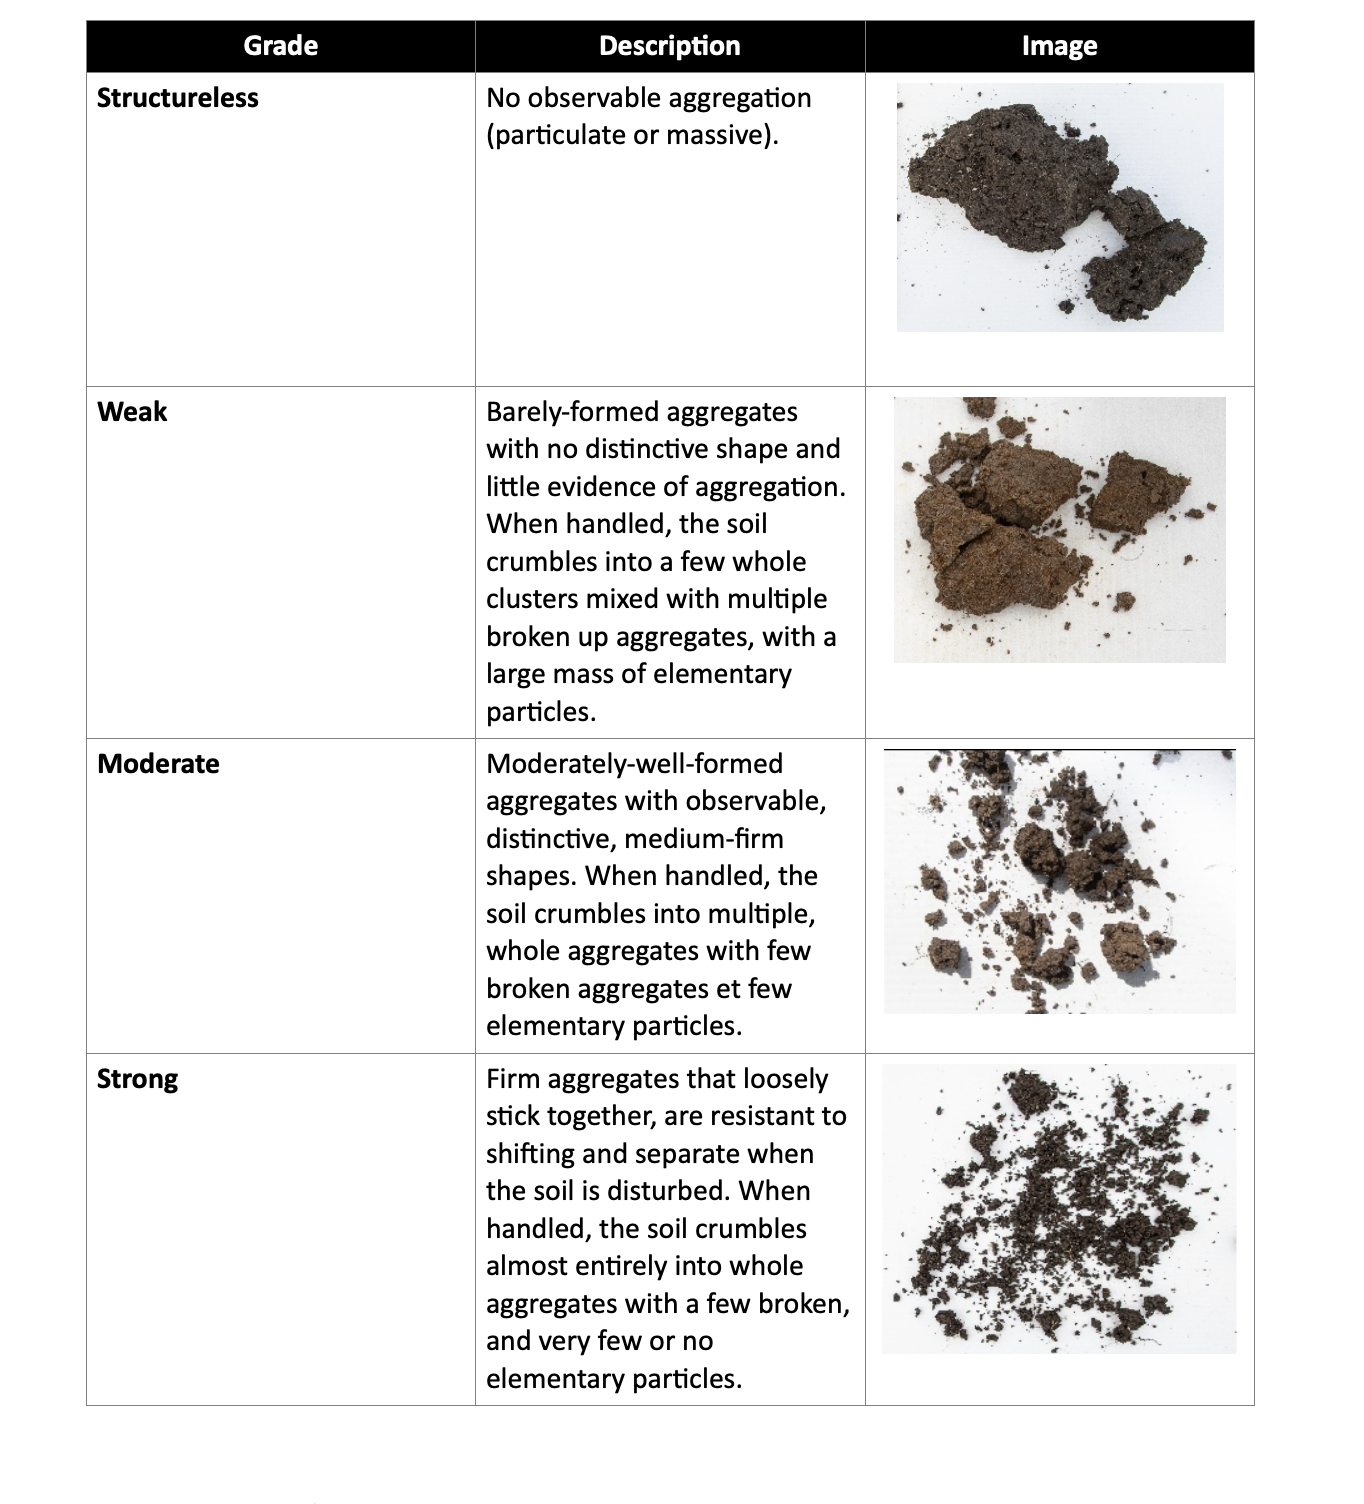
B.6 - Structure Grade
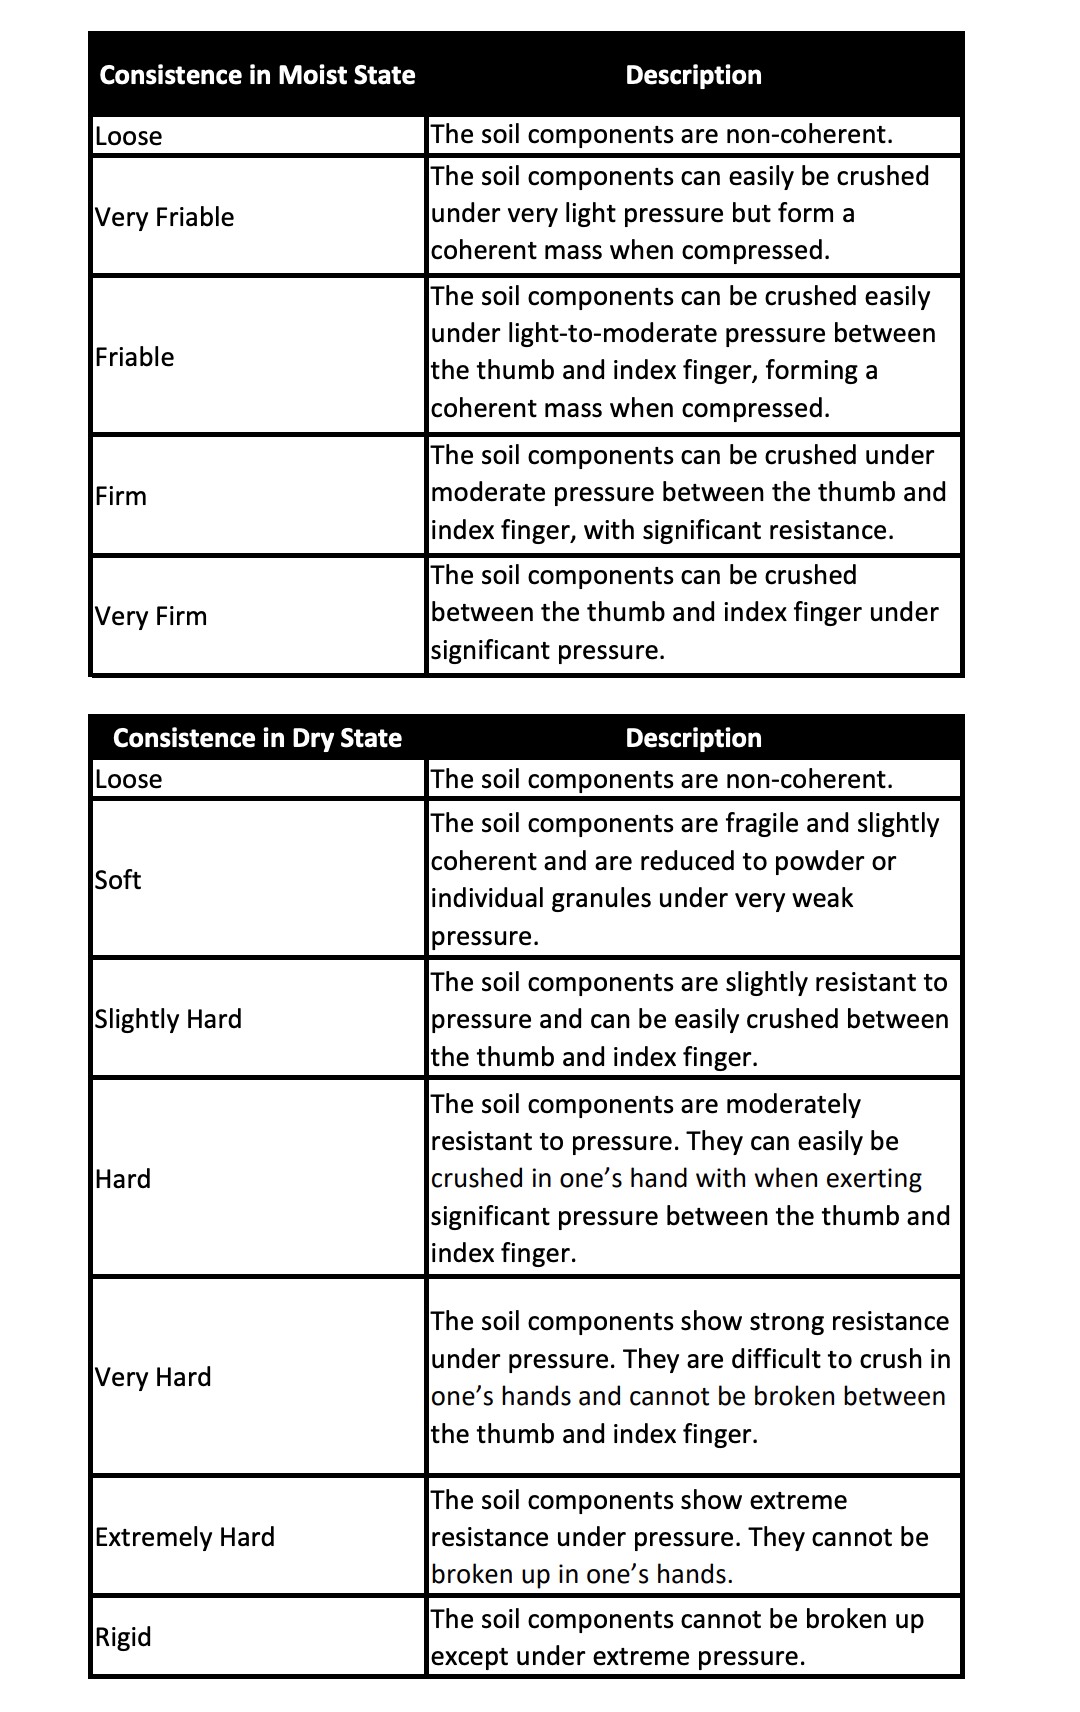
B.7 - Consistence
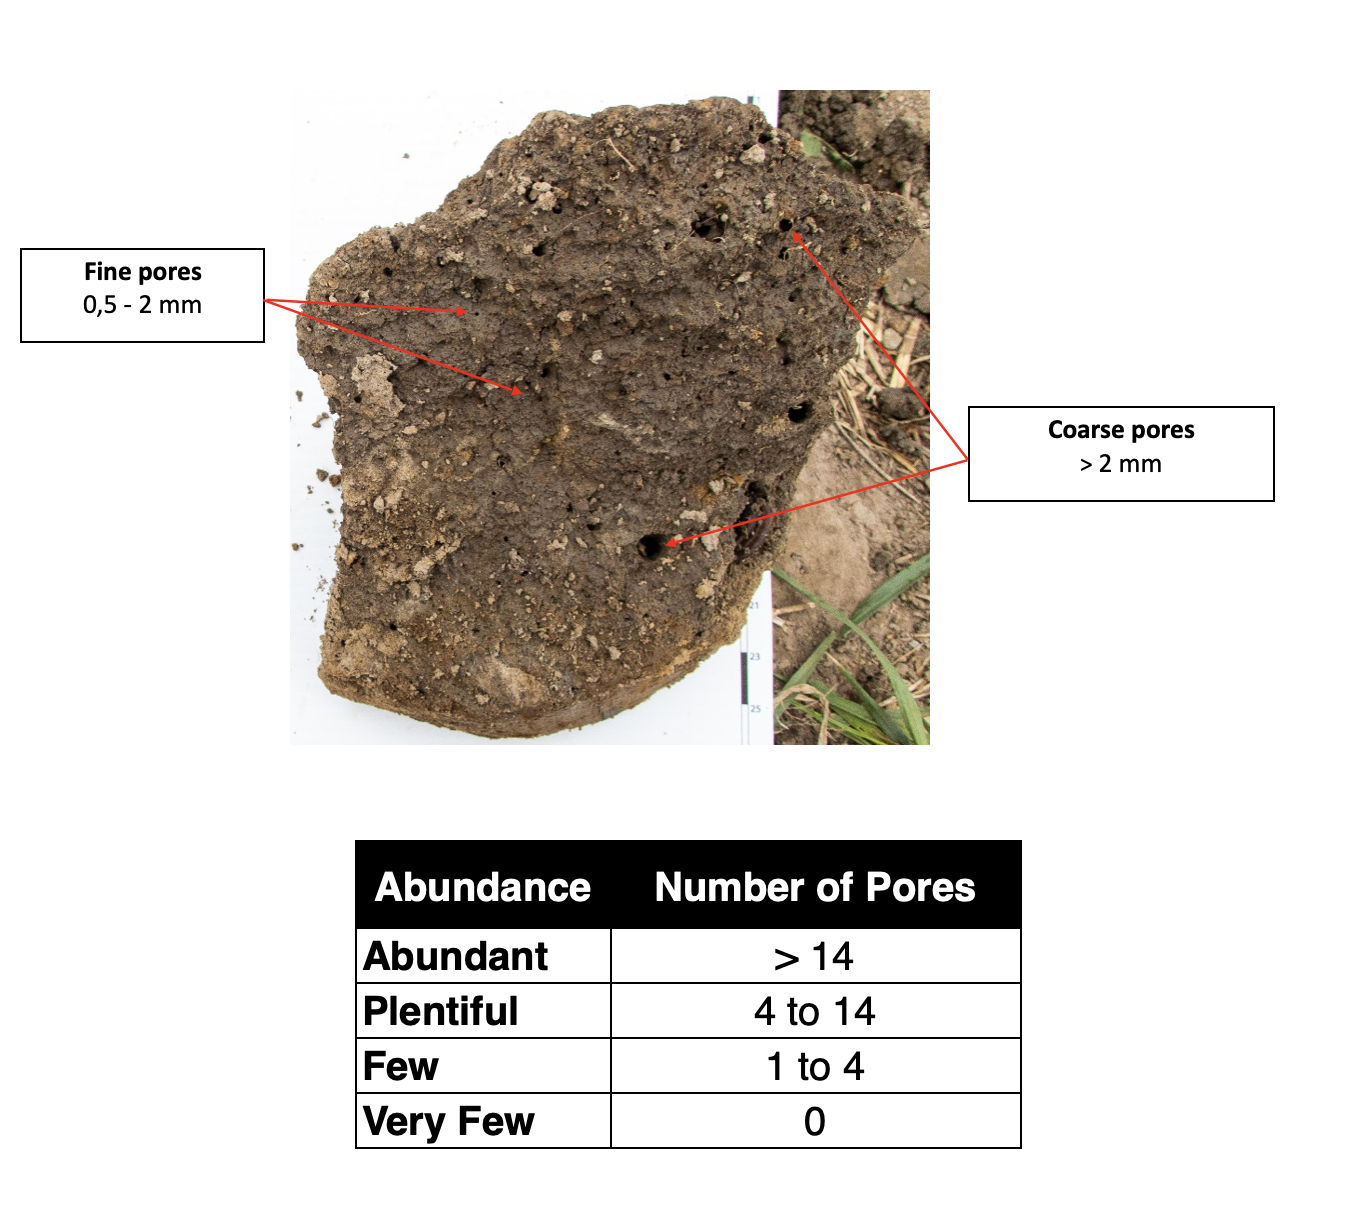
B.8 - Porosity
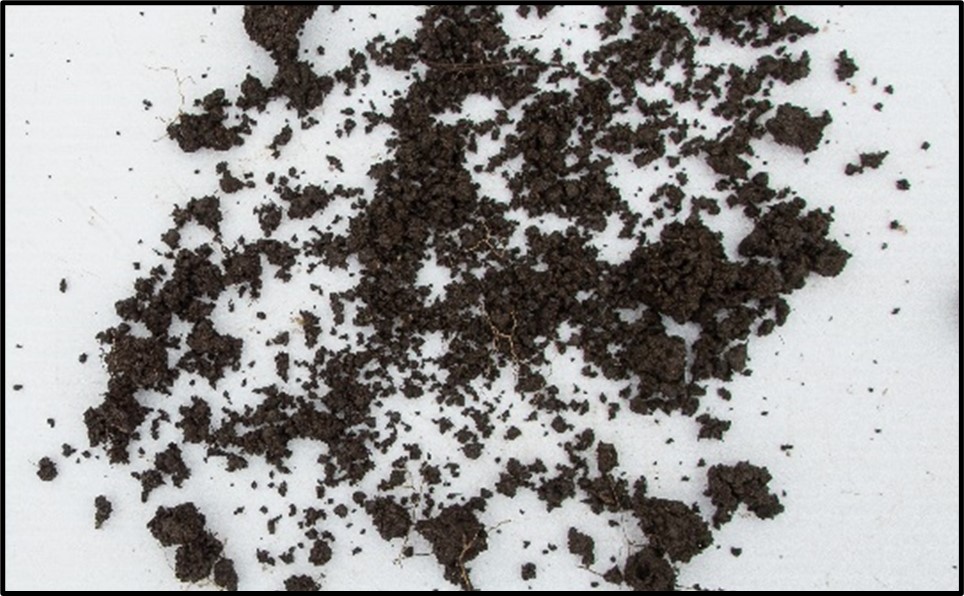
Section C - Image Analysis Evaluation
C.1 - Required materials
- White 33 cm x 44 cm in 4:3 format
- An object for casting a shadow on the coroplast
- Stickers to mark the profile, horizon boundary and layer (optional).
C.2 - Procedure
- Without altering the observed structure, lay out the soil on the coroplast.
- Remove excessive plant debris, pebbles, rocks and other impurities.
- For consistent lighting conditions in overly sunny weather, use an object to cast a shadow over the entirety of the coroplast.
- Take a photo, centering the coroplast as precisely as possible.
- Verify that the photo is in focus.
C.3 - Precautions
- Do not overhandle the sample, to prevent the structure from disaggregating.
- Do not add too much soil.
- Distribute the aggregates evenly on the coroplast.
- Do not capture undesired objects in the photo (e.g. fingers or hands).
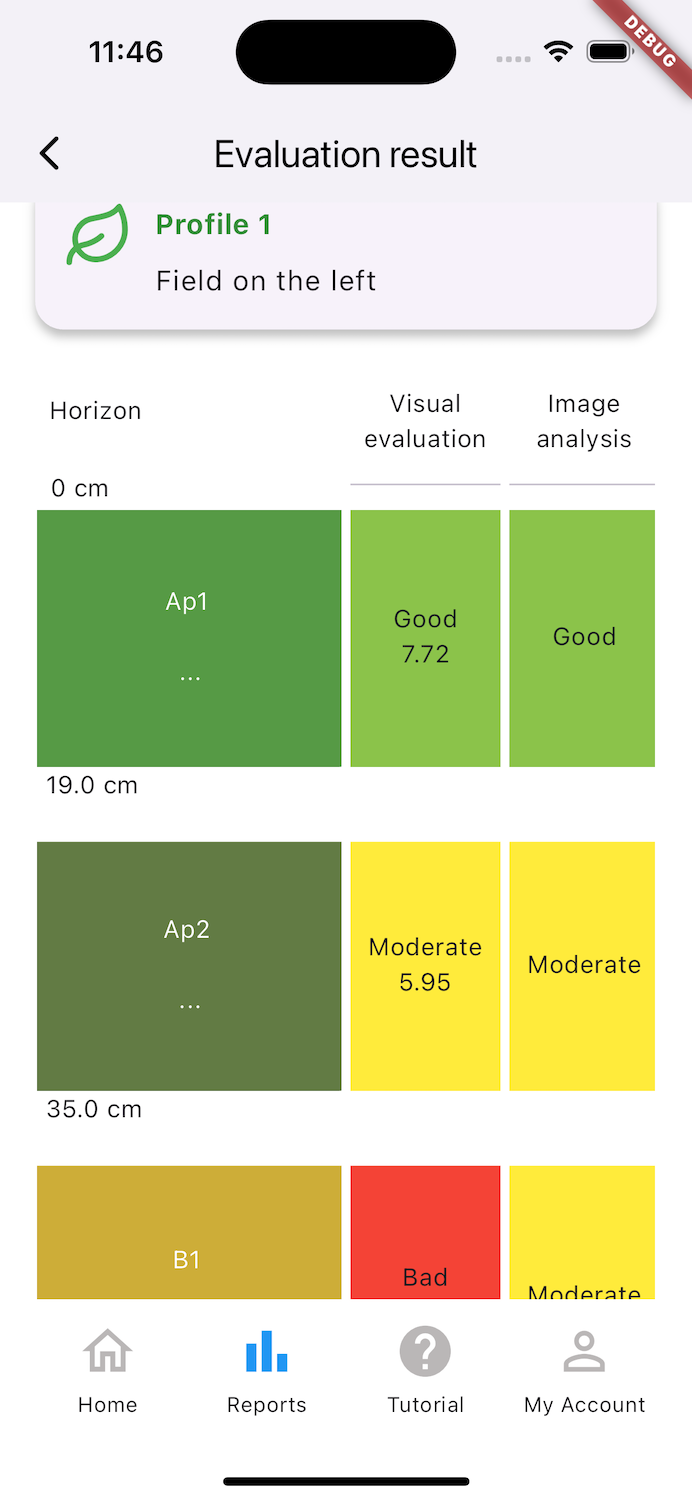
Section D - Interpreting the Results
Section E - Offline Mode
In Offline mode, the device's automatic geolocation is not available. However, you can manually enter the coordinates (latitude and longitude).
In the My Account section, the items FAQ, About Us, Terms of Use, and Privacy Policy are not accessible offline. You must be in Online mode to view their content.
When you create a report in Offline mode, the label Offline appears above the report's name and its creation date.
Section F - Report Synchronization
Reports created in Offline mode must be manually synchronized before export. To do this:
- Go to My Account > Synchronization Status
- Tap the button Synchronize reports and layers
Once synchronization is complete, no report in the list should display the label Offline.
Section G - Data Export
Reports that have been created (whether completed or not) and synchronized can be exported in CSV format via: My Account > Data Export
You can select one or more reports by their name or creation date.
The CSV file can then be shared via email, Google Drive, or WhatsApp. Local storage on the device is only available on Apple devices.
Warning: only reports containing information about layers can be exported.